
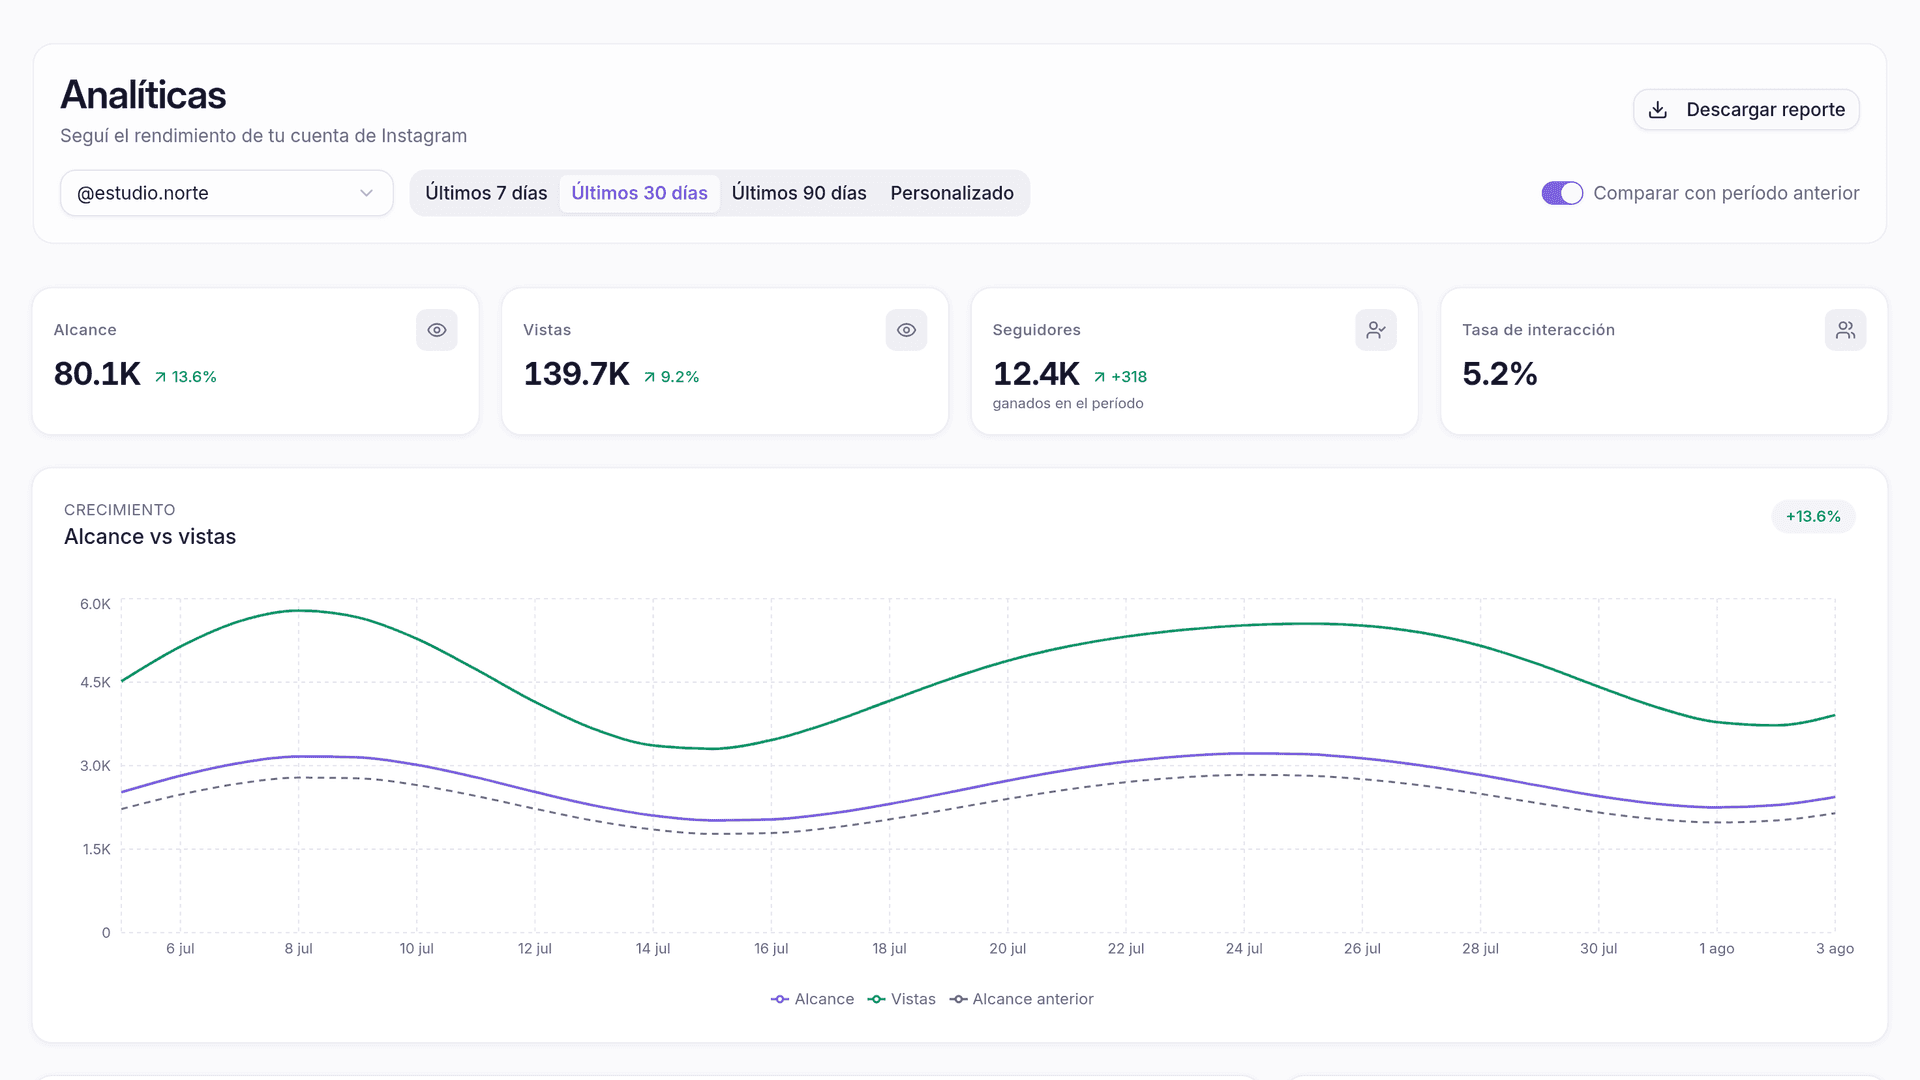
Knowing how an account was doing meant opening Instagram, noting the numbers in a spreadsheet and, at the end of the month, building the client report by hand in a slide deck: copy the metrics, arrange the charts, add the logo, export.
From today both live in Planer. Analytics for the day-to-day, and the PDF report for when you need to show it.
How the account is doing
Choose an Instagram account and a period — the last 7, 30 or 90 days, or any range you want — and right at the top you get reach, views, followers gained and engagement rate.
Turn on Compare with previous period and every number shows how much it changed; in the reach vs views chart, the previous period is drawn as a dotted line behind the current one. Further down is the table of recent posts, with likes, comments, saves, shares and reach for each one.
Which format works for you, and when to post
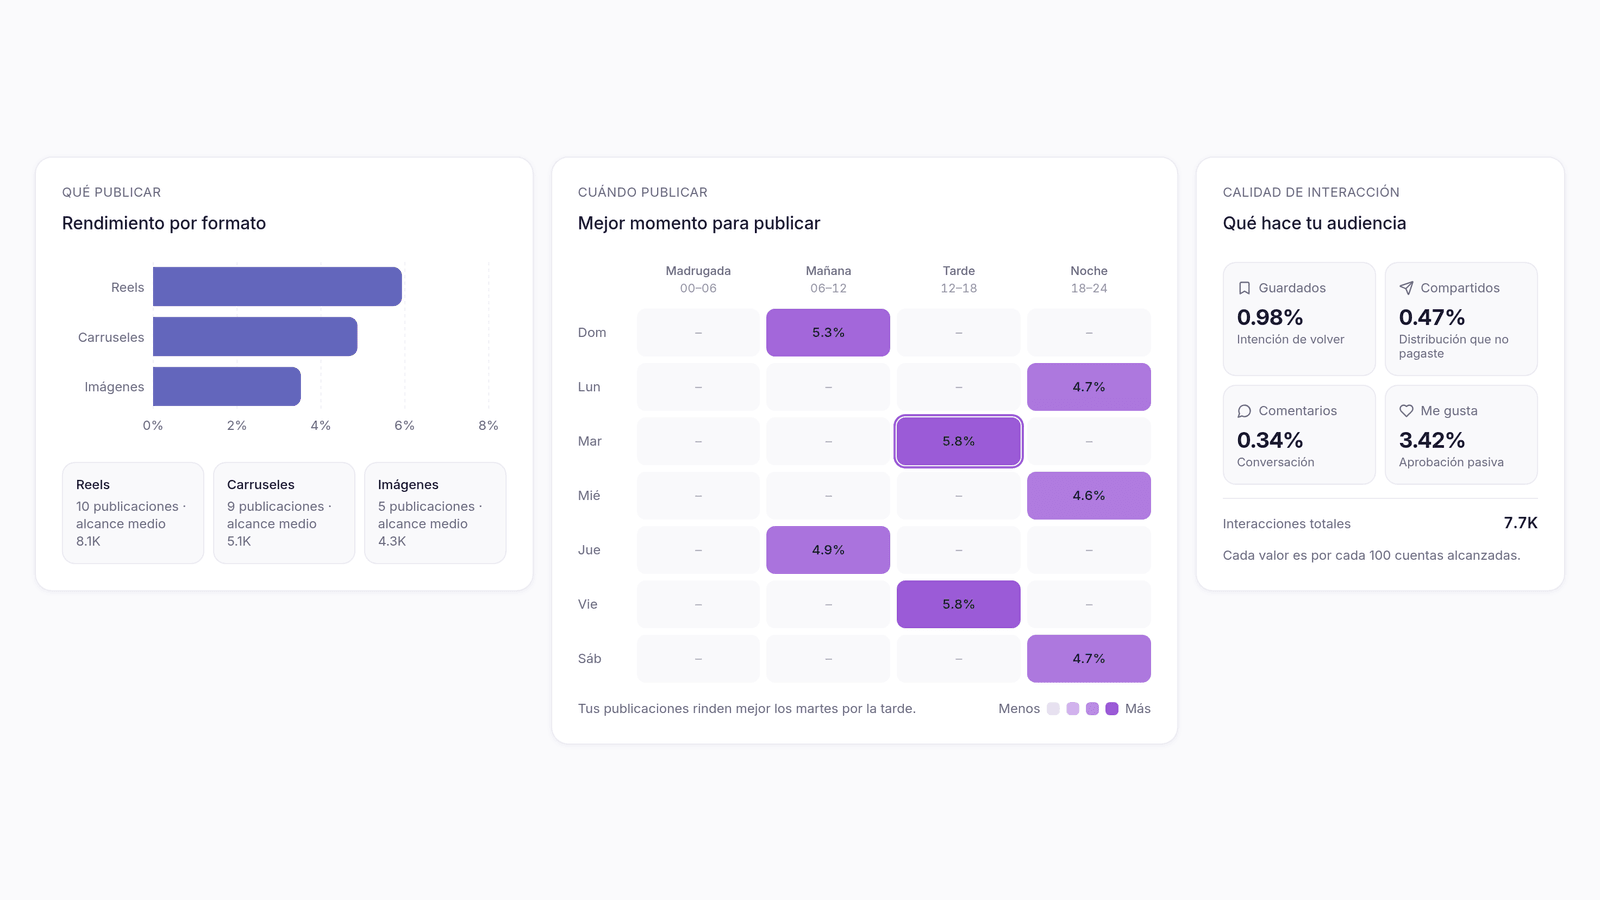
Three panels that answer concrete questions:
- Performance by format — Reels, carousels and images compared by engagement rate, with the average reach and how many posts are behind each average.
- Best time to post — a map of day by time slot (overnight, morning, afternoon and evening) that ends with a one-line reading: "Your posts perform best on Tuesday afternoons".
- What your audience does — saves, shares, comments and likes per 100 accounts reached. A save is an intention to come back; a share is distribution you didn't pay for.
When a time slot has a single post — or the period doesn't have enough data yet — the panel says so instead of showing you a pattern that doesn't exist.
The monthly report, with your branding
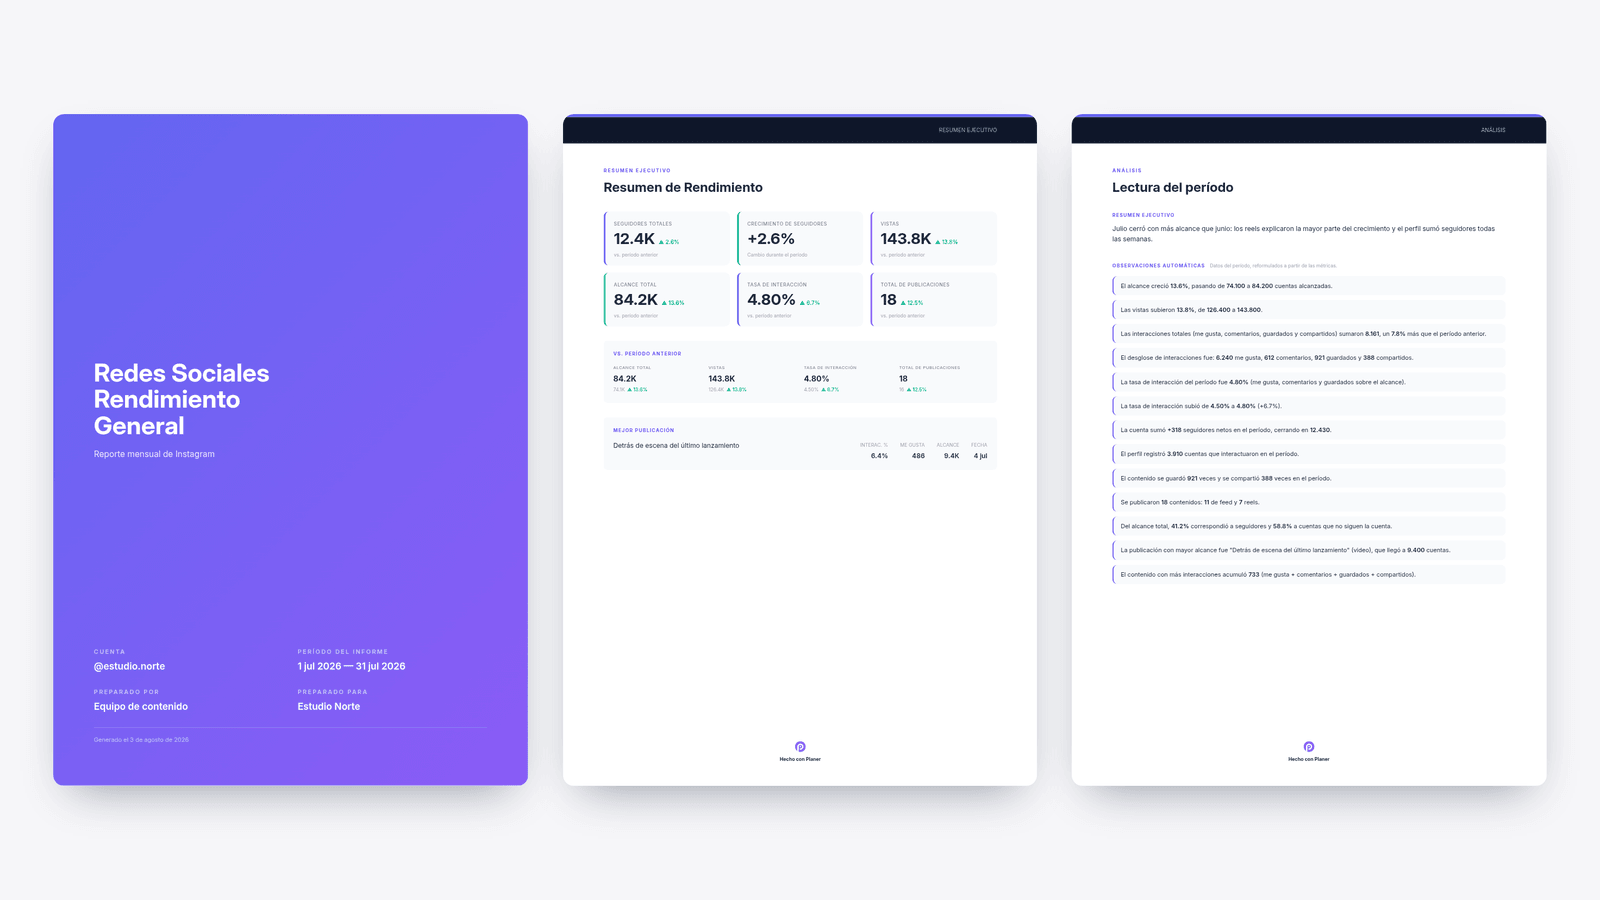
The report is built in steps: choose the period and the language, add the branding — logo, client, author, subtitle — set the style with one of three templates (Modern, Minimal or Corporate) and its palette, and tick which sections go in: summary, growth, engagement, top posts and conclusions. Sections can be dragged to reorder them, and you can add a table of contents.
All of that with a live preview: what you see while you configure it is the real document, not an approximation.
Automatic insights are written for you from your data — "Reach grew 13.6%, from 74,100 to 84,200 accounts reached" — so you don't have to write out by hand what the metrics already say.
Generating the PDF takes 10 to 20 seconds, and the download link stays available for 24 hours.
What you need
- A connected Instagram account.
- From the Starter plan: the analytics dashboard and the PDF report.
- With Pro: write your own executive summary and conclusion, choose which insights go in, and remove the "Made with Planer" footer.
Where to find it
Go to Analytics in the side menu. The Download report button is at the top right of the dashboard.
More updates
Ready to try what’s new?
Start for free and manage all your social media from one place.